Diary - February 2010
John Baez
February 1, 2010
He Who Conquers
There is he whose spirit casts shadows
upon valleys
he who drowns thunder with words
who steps heavy and broad
pressing green into soft wet earth
and there is he who does naught
save to unweave the spider's web
and bind it back again –
Anon
February 2, 2010
Check out this
moonlit fog bow
in Hawaii, with Mars gleaming bright.
February 3, 2010
In email, Robert Smart wrote:
There are lots of "might save the world" stuff that need mathematical help,
but I'd like to suggest something different.
Resource depletion and environmental destruction, and the measures to
counter these things, will play out through the economic
system. Understanding of the economic system is shockingly weak. Much
of the understanding only works in a growing economy, but oil
depletion alone will see economic contraction for a decade or so.
All current mathematical understanding of economics seems to be in
terms of money. But money is one of the oddest things in economics. It
doesn't have the properties of stability it is assumed to have, when
governments can "print" more at the stroke of a pen (quantitative
easing).
So how about running some sort of cooperative Internet thing to try to
build a better understanding of economics. Certainly money and some
other things look like fluids, so there is scope for n-ports. And
maybe the work on large sparse random matrices has something to do
with very large networks with semi-regular features. Obviously I'm
guessing.
When you need to make significant changes to a large complex thing
like the economy, it is wise to understand it better. However I think
there are many other reasons to do this. For one thing: the Nobel
Prize for Economics seems to be a lot easier to get than any of the
others :-).
Robert Smart
P.S. I have been writing stuff in an attempt to understand economics
better in a qualitative way. However we don't understand stuff till we
understand it mathematically.
P.P.S. With the latest feature of
Google
Reader I can get changes to your Diary as if it had an RSS feed.
We'll see if it works.
February 4, 2010
Pretty soon I'm going to start a new blog focused on environmental
and related issues. My plan is to learn stuff by explaining it.
In the meantime, I've been getting some emails on this topic.
For example, in response to Robert Smart's comment
above, Dave Tweed wrote:
Dear John,
Since I saw Robert Smart's comment on your diary, I guess an email is
appropriate. I wouldn't presume to give you advice, but I'll just suggest that
money is not a well-defined fundamental concept in economic theory, and
probably can't be uncontroversially defined. Arguably a more important
understanding in economics is understanding how feedback/system effects can
manifest themselves. From there you can start to figure out what
characteristics money needs to play, and hence how it should be "defined".
One example of the kind of thing is presented here, where it's suggested
that the historic choice of definitions and tools leads to what you consider
the problems to be (namely only those that fit nicely within your toolset
framework):
I'll leave it there, but if youre interested in money as hydraulics consider
MONIAC.
Anyway, best wishes,
Dave Tweed
February 6, 2010
A lot of rain!
We need this rain badly... but it's causing mudslides near the coast.
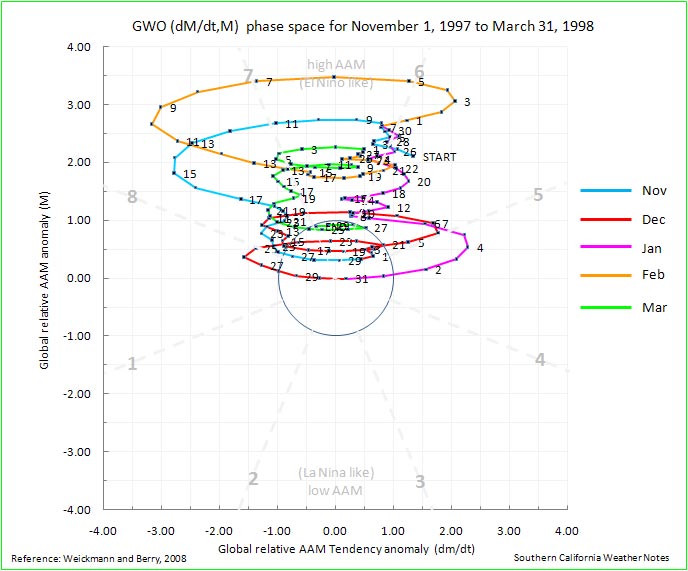
According to Southern California Weather Notes:
The recent enhancement of El Nino convection in the equatorial
Pacific by the Madden-Julian Oscillation (MJO) has triggered a strong
atmospheric response. A Global Wind Oscillation (GWO) phase space plot shows
large increases in relative atmospheric angular momentum (AAM) and
AAM tendency. As a result of this increase, the average relative AAM
anomaly for the rain season to date is now positive. As mentioned in
this post
from December 2009, relative AAM is correlated with rain season
precipitation in Southern California. This suggests an increased
likelihood of wet weather in Southern California in the medium range
outlook period.
That December post says:
Will the current El Niño produce the expected seasonal impacts in Southern
California? A new tool that can help gain some insight into the linkage of
climate and weather is the
Global Wind Oscillation (GWO) phase space plot.
Ed Berry repeatedly demonstrated the usefulness of this tool in
his blog Atmospheric Insights. Although the blog has been discontinued, its content
remains a valuable resource.
The GWO is a recurring subseasonal phenomenon that involves the transport
and interchange of momentum in the earth-atmosphere system. It encompasses
the MJO and occurs on a similar timescale. Analogous to the MJO phase space
plot, but based on a framework of atmospheric angular momentum (AAM), the
GWO phase space plot is a measure global relative atmospheric angular
momentum and its tendency. For details, see Weickmann & Berry, 2008.
Relative AAM is generally positive during an El Niño and negative during a
La Nina. Relative AAM is correlated with rain season precipitation in Southern
California, and can be helpful in assessing potential El Niño impacts.
The following November to March GWO phase plots show the distinctly
different behavior of the GWO during the strong El Niño of
1997-98, and the strong La Nina of 1973-74:
In a decade characterized by quirky El Niños, the El Niño of 2009-10 has
been acting like another odd one. From a Southern California perspective,
the concern has been that it might be like the El Niño of 2006-07 when
Downtown Los Angeles recorded only 3.21" of rain over the water year. In
the early stages of the El Niño of 2006 strong convection developed in the
Indian Ocean during November, but an MJO did not develop until a second
round of Indian Ocean convection occurred in mid December. Relative AAM
remained negative, and in terms of the atmosphere, the 2006 El Niño didn't
make it to 2007.
This year, Indian Ocean convection did spawn an MJO which
eventually
enhanced El Niño convection near the dateline. Significant momentum was
added to the mid-latitudes of the Northern Hemisphere, energizing the
westerlies and contributing to the pattern change that resulted in our
recent wet weather. However, the increase in mid-latitude AAM has been mostly
offset by negative anomalies at higher latitudes. Following are the
GWO phase space plots for the current rain season to date, and the
quirky El Niño of 2006-07.
Luckily the El Niño seems to have gotten its act together by now and
produced some hefty rains!
I'm struggling to understand the graphs shown above.
I believe that the quantity called M is defined on
page 7 of this paper:
It seems to be an estimate of the total angular momentum of the
Earth's atmosphere: AAM means "atmospheric angular momentum".
Angular momentum is a vector, but they're only considering the
component aligned with the Earth's rotation, since winds tend to
blow east-west. A typical value of the angular momentum of the
Earth's atmosphere is 1.25 × 1025
kilogram meter2 / second.
This corresponds to a uniform wind blowing due east at a speed of
0.5 meters/second over the whole planet's surface.
The graphs above also show the time derivative dM/dt.
A typical value of this is 1.8 × 10¹⁹ kilogram
meter2 / second2.
I don't know what units the graph is using, but you can get the
idea: an El Niño tends to boost the overall westerly flow of the planet's
winds, while La Niña boosts the easterly flow. According to
Rich Monastersky, writing for Science News:
During non-El Niño years, winds in the tropics tropics, also called tropical zone or torrid zone, all the land and water of the earth situated between the Tropic of Cancer at lat. 23 1-2°N and the Tropic of Capricorn at lat. 23 1-2°S. blow from east to west, whereas winds over the rest of the globe travel from west to east. Combined, they give the atmosphere a net eastward momentum.
The atmosphere routinely trades some of this momentum back and forth with the solid Earth as winds drag across the surface of the planet and push against mountain ranges. In the Northern Hemisphere's winter, the atmosphere speeds up and Earth slows. In summer, the reverse happens.
El Niño boosts the atmosphere's angular momentum by slowing down the tropical easterlies and speeding the westerlies outside the tropics, says Salstein.
As the atmosphere speeds up during El Niño, Earth itself slows down to conserve the combined angular momentum. John M. Gipson of NASA's Goddard Space Flight
Center in Greenbelt, Md., has tracked the planet's spin by monitoring changes
in the length of the day. Over a typical year, the day shortens and lengthens
by roughly 1 millisecond, mostly because of shifts in atmospheric angular
momentum. During the current El Niño, the day has grown longer by four-tenths
of a millisecond, he says.
For more, try:
February 7, 2010
In week293 of This
Week's Finds, I announced that I'm going to quit writing This
Week's Finds in Mathematical Physics after
week300, and start a slightly
column, This Week's Finds, which will address a new range of
issues. I'm going to start by examining the case for human-caused
global warming.
My friend Nathan Urban writes:
Strange to hear that TWFMF is ending ... but good to hear there will
still be a TWF! And I think it will be a lot of fun for you to explore
these new areas. It was for me.
A few things which come to mind as I read Week 293:
Photovoltaics are definitely the most interesting from a quantum physics
and optics perspective ... but there's also boring old concentrated solar
thermal (i.e. mirrors and steam turbines) which is already a pretty
developed technology and doesn't suffer from limited supplies of rare
earth elements. (Instead it needs water, which can be problematic in
deserts! But some have proposed using molten salt to use for heat storage
during night time, although you still need water for the turbines.)
Some papers on the decline and future of Arctic sea ice:
-
Donald K. Perovich and Jacqueline A. Richter-Menge, Loss of Sea
Ice in the Arctic.
-
Dirk Notz, The future of ice sheets
and sea ice: Between reversible retreat and unstoppable loss.
-
I. Eisenman and J. S. Wettlaufer,
Nonlinear threshold behavior during the loss of Arctic sea ice.
-
Julien Boi, Alex Hall and Xin Qu,
September sea-ice cover in the Arctic Ocean projected to vanish by 2100.
-
Ian Simmonds and Kevin Keay Extraordinary September Arctic sea ice reductions and their relationships with storm behavior over 1979-2008.
-
R. Kwok et al,
Thinning and volume loss of the Arctic Ocean sea ice cover: 2003-2008.
-
R. W. Lindsay, J. Zhang, A. Schweiger, M. Steele, and H. Stern,
Arctic Sea Ice Retreat in 2007 Follows Thinning Trend.
-
James Maslanik et al,
On the Arctic climate paradox and the continuing role of atmospheric circulation in affecting sea ice conditions.
Papers on wind (and solar) spectra:
Jay Apt at CMU has been working on the inefficiencies induced by having
to match the wind power spectrum to the electricity grid spectrum.
You talk about mesoscale and large-eddy simulation. This ties into
"multiscale simulation", which is about how to represent sub-grid
scale physics in a large-scale numerical simulation. Common approaches
are to treat the sub-grid scale physics stochastically in some way as
"unknown physics with given statistical behavior", either analytically
or by embedding small-scale simulations inside larger ones to numerically
compute said statistics. There are a number of mathematicians working
on this, e.g. at these UCLA workshops this spring:
See e.g. work by Andrew Majda, Ilya Timofeyev, Weinan E, and others.
There is some debate as to how to do this properly, between
"heterogeneous multiscale" vs. "equation free" approaches.
(I gather the former is more systematically mathematical, and
the latter is more purely numerical.)
Multiscale modeling is particularly important in modeling cloud
physics since clouds are hugely important to the Eath's radiative
balance but are too small to realistically model globally, hence "cloud
superparameterization". See:
JB wrote:
I have some ideas. For starters, something like science journalism /
blogging, but with a focus on issues where we need a scientist to
understand technical details and then explain them clearly. I think I'm
good at that.
Yes, that could be a good strategy. There are a number of topics which
I think could benefit from a good technical exposition. In fact, I've
toyed with writing a little book about this, with simple qualitative
reasoning about systems dynamics. You can probably explain these things
much better than I could.
1. Why the "urgency"
People need to understand better the ideas of sources/sinks in systems
analysis and the concepts of physical and socioeconomic inertia. This
is, e.g., one of the themes of the Solomon "irreversible climate
change" paper you've mentioned.
For example, people often think that we just have to stop increasing
our CO2 emissions and the problem will be solved. But
CO2 levels will continue to increase as long as emissions
(source rate) exceed the sink strength, and natural carbon sinks are
much weaker than current emissions: terrestrial sink takes about 1/4
of what we emit, the oceans take about 1/4, and 1/2 stays in the air.
So we'd have to drop emissions to half what they are now before
natural sinks can even keep up with them, let alone reduce
CO2 (assuming that the strength of natural sinks stays
constant). A lot of people get confused between CO2
concentrations and CO2 emissions/sinks:
Related concepts are "airborne fraction" or AF (how much anthropogenic
CO2 stays in the air) and whether AF is changing (and how
that relates to how CO2 concentrations are
changing, some people falsely think that a constant AF means
CO2 isn't increasing). Also misunderstood is the
difference between carbon atmospheric residency time and the e-folding
time of carbon sinks. A given CO2 molecule only spends a
few years in the atmosphere before ending up in a sink, but the
effective lifetime of atmospheric CO2 is much
longer, decades to centuries on average. (Analogy: a molecule is
emitted and quickly absorbed by some sink, leaving CO2
concentration unchanged. But how long for CO2
concentration to decrease? For that, maybe you have to grow
a whole new tree to absorb the extra CO2 molecules that
aren't already being absorbed by existing trees.) This confuses many
people:
In fact, there are multiple timescales involved in carbon sinks, and
some of them are very slow. This is where I think Mason Inman's
analysis and David Archer's work (e.g., The Long Thaw) are more
relevant than Franklin Cocks, as you discuss in your diary. A lot of
CO2 is going to be around for a long time, and this may
affect the ice age cycle itself:
So, it's not just a matter of keeping emissions steady, we have to cut
them, and cut them a lot, before atmospheric CO2 will
actually stabilize or decrease. And ultimately, even cutting
emissions to zero isn't going to necessarily avoid dangerous climate
change. For example, if we cut them to zero by simply burning all
fossil fuels! If we want to avert the full amount of climate change
possible, we have to leave fossil fuels in the ground and
never burn them, not just burn them more slowly (e.g., by more
efficient use of energy). Otherwise, you're just delaying the problem
a little. (There's so much focus on 2100 that people forget that a
huge amount of global warming in, say, 2200 is also a problem!) What
really matters is our cumulative emissions, the total amount
of fossil fuels we will ever emit, and how much less that is than the
total amount available. See here:
People don't understand this either. Many think that all we have to do
is be more energy efficient, but this isn't going to stop us from burning
fossil fuels, it will just slow it a little. To stop burning fossil
fuels altogether, they have to become more expensive than alternatives
(or regulated). (Also related is the Jevons paradox: if we become
more efficient, that just lets us burn more fossil fuels for the
same cost! To keep consumption down, economists have argued that
you need a price incentive or need to regulate consumption.)
Then there is inertia. If we mitigate our emissions, we're not going
to see that reflected in the climate system immediately. Most of
the heat capacity in the planet is in the oceans, with a characteristic
heat mixing timescale of decades. That's how long it takes to fully
adjust to changes in radiative forcing (and the time also depends on
feedback strengths, with stronger feedbacks implying slower responses).
You can see this by analyzing the simple linear response model:
C dT/dt =
F - λT
where T is temperature, C is heat capacity, F is radiative forcing
(e.g. log CO2 concentration), and λ is a feedback
factor (inversely related to climate sensitivity).
The oceans will slow the climate response to anything we do, sea level
rise from thermosteric expansion will continue as long as the oceans
continue to heat as they try to re-equilibriate. Ice sheets have even
slower response times.
Then there is socioeconomic inertia. People often think we should be
embarking on a crash program to develop breakthrough energy technologies.
That just takes too long to rely on. It probably takes about 50 years
from initial research, to development, to deployment, to widespread
deployment for a new energy technology. Breakthroughs could eventually
help, but things we can deploy widely now (like simple baseload solar)
are the most important, when coupled to the long lag times in the
climate system itself.
2. Climate sensitivity and feedbacks
What is CO2 going to do to the climate? Well, we expect
about 3.7 W/m2 extra radiative forcing, top of atmosphere,
from doubled CO2. (Radiative forcing is logarithmic in
CO2 concentration, basically the Beer-Lambert law, so we
count CO2's effect in terms of doublings.) This is
expected to produce about 1 C of warming for each doubling. That by
itself is not too bad. It's the feedbacks which get you: they can
increase the response to 3 C or more. These are things like water
vapor increases in a warmer climate (water vapor is a greenhouse gas),
ice albedo feedback (melt ice, Earth's surface is darker and absorbs
more heat), cloud cover changes, changes in the carbon cycle, etc.
That's where most of the problem, and most of the uncertainty in how
bad the problem is, comes from. I think people could use a good
introduction to linear feedback theory in the climate system.
Something like a layman's version of this:
3. Climate surprises, thresholds, nonlinearities, and abrupt
climate change
These are the big risks which might be unlikely but could be so bad
that we ought to take steps to reduce their risk anyway. Disintegration
of major ice sheets, collapse of the Atlantic overturning circulation
(although that's looking like less of a risk), runaway permafrost or
methane clathrate melting, etc. Some of these can occur if you pass
a "threshold" (bistable system, can exhibit hysteresis) and can be
effectively irreversible. For example, if you melt Greenland and later
reduce temperatures back to pre-industrial, the ice sheet won't return
to its pre-industrial state. It will be gone. You need an ice age
to rebuild it. I bet you could show this analytically in a simple
conceptual model.
Some miscellaneous links that come to mind, perhaps not the best selection:
-
Timothy M. Lenton et al,
Tipping elements in the Earth's climate system.
-
Jonathan M. Gregory, Climatology: Threatened loss of the Greenland ice-sheet.
-
Young-Gyu Park,
The Stability of Thermohaline Circulation in a Two-Box Model.
-
R. B. Alley et al,
Abrupt Climate Change.
-
Reto Knutti and Thomas F. Stocker,
Limited Predictability of the Future Thermohaline Circulation Close to an Instability Threshold.
-
R. J. Stouffer, K. W. Dixon, M. J. Spelman, and W. Hurlin,
Investigating the Causes of the Response of the Thermohaline Circulation to Past and Future Climate Changes.
-
Jonathan Bamber,
What happens when an ice sheet melts?
-
this.
-
this.
JB wrote:
Then, maybe learning enough and getting to know enough people to tackle
some more specific technical projects.
Not sure what I can suggest about that, as most of the mathematical
research I know of in climate science is pretty far from "abstract
nonsense" and bond diagrams ... more numerical analysis.
JB wrote:
Apparently people need better modelling techniques all over, especially
for designing the "smart grid". I can sense an opportunity for abstract
nonsense like "bond graphs" here.
I'm no expert on "the smart grid", but you might want to look at CMU's
energy research:
Some interesting people in their Engineering and Public Policy department
are M. Granger-Morgan, Jay Apt, Lester Lave. For electricity research,
see their Electric Industry Center:
At Penn State we have Seth Blumsack (who did his PhD at CMU) who works on
energy grid design (although mostly from an economic policy perspective
rather than, say, network design and modeling):
February 10, 2010
Another bit of rain.
February 12, 2010
Tim van Beek writes:
Dear John,
I always wondered if climate models that try to predict sudden climate
changes could profit from the knowledge that physicists have about phase
changes in condensed matter physics. Item 3 in Nathan Urban's
email, "Climate surprises, thresholds, nonlinearities, and abrupt
climate change", reminded me of this analogy. The article
was particularly interesting to me for this reason.
The following article is a little addendum to this:
That requires a subscription, unfortunately, but the authors are
— remote — colleagues of yours.
By the way, the Potsdam Institute of Climate Impact Research has a
nice homepage
that will be a good distraction, should you suffer from insomnia.

Kind regards,
Tim van Beek
February 13, 2010
In South Carolina, terrorists now need to register with the state.
Here's the form:
There's a $5 filing fee. You have to outline the fundamental
beliefs of your subversive organization, attach a copy of its bylaws
or the minutes from your last meeting, and list your members.
February 14, 2010
It's Valentine's Day!
And last night we had our Lunar New Year party, where the guests
help us make jiaozi — the dumplings that are traditional
for this occasion in China.
Charlie Clingen writes:
Hi, John-
Recently I've been thinking a lot about your change of direction and what you
will be doing next. I'm beginning to form a clearer idea of what I think you
could do (and enjoy doing) in order to have a significant impact of the
future direction of our country and our planet.
I'll sketch the outline and see if it appeals to you at all.
First, I'm assuming that we do best that which we like most to do (and vice
versa). It seems to me that some of your most outstanding abilities include:
the ability to summarize difficult, technical concepts and relate them to
each other in new and interesting ways; the ability to explain complicated
ideas clearly in novel and interesting ways; the ability to organize and
display large amounts of interrelated information in efficient ways. You
are also good at keeping blog responses under control before they spin
off into flame wars.
Given that, and your past history as visible to me, I'm guessing that the following might be of interest to you.
A summary:
-
You can create a new blog intended for use by professional, technical people
world-wide, with expertise in fields related to climate analysis, energy
production, natural resource conservation and pollution control.
-
You would initiate discussions in several strings, including those just
mentioned, by writing a brief introductory summary paper for each topic
stating your understanding of the state-of-the-art plus the severity of
the threat and the purpose of the discussion in the blog.
-
You would monitor discussions forcing people to give their professional
opinions, not their personal opinions. You would emphasize the requirement
for data as opposed to beliefs and opinions. Relentless reinforcement of
that requirement would be an effective way to keep the wingnuts at bay.
-
You would collect papers and publications, much as you are now doing, and
consolidate them on an ongoing basis into bibliographies for future reference.
-
You, with the help of some new-found colleagues, would prepare, update
continuously, and display online, perhaps in style of This Week's Finds,
summaries of the state-of-the-art and the state-of-the-crisis for various
areas, such as those proposed above.
-
Perhaps your most valuable contribution, in addition to all the hard work
above, would be the imposition of your professional value judgments upon
all of this information. It would be up to you to aggregate and prioritize the
various professional results and then "make the call", stating
authoritatively what it all means. This will make you uncomfortable, because
you know you will make mistakes. But that doesn't matter. What matters
is that you will be right most of the time, and the fact is that you will be
in a better position to make such judgments calls, and you, personally and
technically, will be better equipped to make such broad, cross-specialty
value judgments than anyone else. So, you should just go for it. Be the
oracle, be the wizard. When people challenge you, point them to your
summary papers and ask them to provide data that disproves your conclusions.
If they can do so, accept it gratefully, change your summary, and move on,
just as you do today in This Week's Finds and the n-Category Café.
That's what we all need in these crazy, confusing times of change and chaos.
-
These summaries would be written with the objective of being referenced and
quoted as the authoritative status of the state-of-the-art and the
state-of-the-problem. I will take a couple of years for you to achieve that
level of acceptance, but it is possible, indeed probable, if that is your
objective.
-
Success would be measured by how widely known and accepted your summaries
become. One of the most difficult challenges would be to find a way to get
them properly quoted by the popular press, rather than misquoted, as is almost
always the case. This would probably require you and your colleagues to submit
yourselves to media interviews from time to time in order to set things
straight.
So, in a nutshell, that's a summary of my thoughts. I haven't thought
through clearly yet the proper division of responsibility between blog
discussions and on-line technical summary papers, but you know a lot more
about that than I do.
As usual, I have violated one of my own "Charlie's Laws": "Never define a
problem by stating your solution." But hey, sometimes I just can't help myself.
Hope this gives you some useful food for thought.
I believe you have the potential to make a big difference. Go for it!
If later you decide it's not for you, you always have plan B — the
deeper integration of advanced math and theoretical physics.
Best regards,
Charlie Clingen
This plan appeals to me, not only for noble reasons, but also
for ignoble ones. I enjoy grandstanding and being at the center
of attention. Unfortunately, pursuing this plan would require
a vast amount of energy and dedication on my part —
especially the parts that involve dealing with other people.
I have a lot of energy when I'm doing what I want to do,
but my interests flit around in a somewhat unpredictable way.
I want to indulge that tendency a bit more than I've been able
to recently. One reason I want to quit working on n-categories is
that it started feeling very burdensome: there were more and more
half-completed papers I needed to finish, less and
less time for free exploration. I feel much happier if I wake up
and have a few hours to do whatever I want — whatever excites
me at the moment! That's when I come up with good ideas.
As soon as I quit working on n-categories, I started having
lots of good ideas.
This Week's Finds suits this aspect of my personality —
it lets me jump from subject to subject without feeling guilty
about it. I like the idea of
writing a This Week's Finds whose scope is broader, including
environmental issues. But making myself into a dedicated compiler of
information — "the oracle, the wizard" —
and building up people's expectations that I'll be there whenever
they need a judgement rendered — that doesn't sound so good.
I'll burn out!
So, I need to tweak Charlie Clingen's plan a bit. I want a role that's
a bit less grandiose, a bit less of a full-time job.
Also: when my 5 grad students finish up, I'm going to switch back
to having one or two at most. It's great fun having a big team of
people to work with. But doing research with grad students is like
driving a train: it takes a long time to start them up on something,
and you can't stop a project suddenly, or turn on a dime. When I get
more seriously into work on ecology, engineering, quantum computation
and the like (and maybe algebraic geometry with Jim Dolan), I want
to become more maneuverable.
February 16, 2010
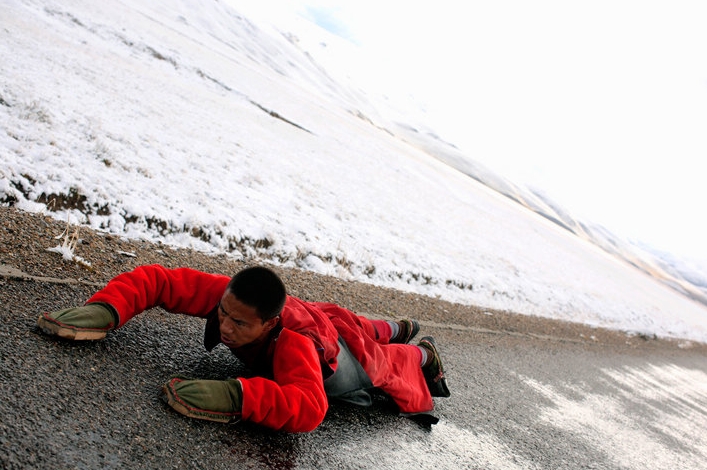 A Tibetan Buddhist monk on a road in the Qinghai province of
China.
A Tibetan Buddhist monk on a road in the Qinghai province of
China.
He is on a pilgrimage to Lhasa, 400 miles away. The
journey will take about six months.
Photograph by Christopher
Brown of NPR.
Here's a fun and enlightening
radio show about a journey down the Mekong River:
I'll be pretty near some of these places when I move to Singapore!
I'd like to visit Cambodia and Laos. But I don't want to get anywhere
near the opium fields of the Golden Triangle, or Myanmar. Those places
sound like trouble.
February 20, 2010
It rained last night!
As you can see, I'm trying to get myself into the swing of living
in Southeast Asia a little bit before I actually go there.
So I found this story interesting:
A condescending story title, but a nice story about
an album of Cambodian rock music from the late 60's and early 70's
— the good old days, before
the Khmer Rouge took over and devastated the country,
killing almost a quarter of the population
through execution, torture, forced work and starvation.
The album is called Electric Cambodia, and
it was compiled by a band called
Dengue
Fever.
This sort of music can grate on Western ears. For starters, the high-pitched,
sweet but slightly whiny female vocals in Cambodian music don't sound
"cool". It reminds me a bit of how Lisa used to combat neighbors
who played loud rock music by playing Chinese opera at full volume!
And there can also be something a bit pathetic about Asian
attempts to imitate Western music fads. You think "why don't they
do their own thing?" But music styles are like highly contagious
viruses — they hop unstoppably from culture to culture, mutating
in weird ways as they go. And I'm learning it's good to check your
pre-established notions of "cool" at the door if you want to
explore a wide range of music. And so, I think I could get to like
this stuff.
Here's what I'm listening to these days. Click on the artist's name
for more information on them, or the album title to hear a bit:
-
Bill Frisell, Disfarmer.
Jazz guitarist with band playing deep, haunting miniatures with
interlocking themes.
-
Blossom Dearie,
Verve Jass Masters 51. Jazz singer and pianist with a baby-doll voice — may sound
corny at first, but it grows on you. These days when Lisa and I drive
to the grocery store we practice singing along to
Rhode Island
is Famous for You.
-
Aphex Twin,
Drukqs.
Aphex Twin is Richard James, and Richard James is a madman. Here he plays
grating, wildly energetic techno interspersed with otherworldly, sometimes
gentle prepared piano tracks.
-
Richie Hawtin,
Musik.
Techno put out by Richie Hawtin under the monicker "Plastikman",
with some entrancing tracks like
Plastique
and Marbles.
The excitement comes from gradually changing timbres
made on some classic Roland synthesizers.
You need good speakers to fully appreciate these sounds.
On my tinny computer speakers, this music sounds like crap.
-
Michèle Claude et L'Ensemble Aromates,
Jardin de Myrtes: Mélodies Andalouses du
Moyen-Orient.
Beatiful Andalusian melodies played on traditional instruments.
It's slightly marred by the Western classical style of the
instrumentalists — it doesn't "swing" as much as it
could. But it's still good, and the title track is unforgettable.
-
Eduardo Paniagua
Group,
Danzas Medievales Españolas.
Truly ravishing performances that explore the interplay between north
African music, Andalusian music and the music from the Catholic
tradition in medieval Spain. Unlike the previously listed album,
Eduardo Paniagua's musicians have a fiery sense of rhythm. It's
absolutely tragic how hard his albums are to find — I just
shelled out $30 for Latidos de Al-Andalus.
But Danzas Medievales Españolas is easy to find.
February 21, 2010
Mike Stay
has some great pictures on his blog:
February 22, 2010
Simon
Willerton arrived in town last Tuesday — he's a pal of
mine, a mathematician from Sheffield who works on quantum topology.
He's going to be visiting Riverside until the end of April. We had
him over for dinner last night, along with a music professor at UCR named
Paolo Chagas,
who Lisa met recently — he turned out to live just a few
It was cloudy all day yesterday, and last night it finally broke
down and rained again! The hills are nice and green.
February 24, 2010
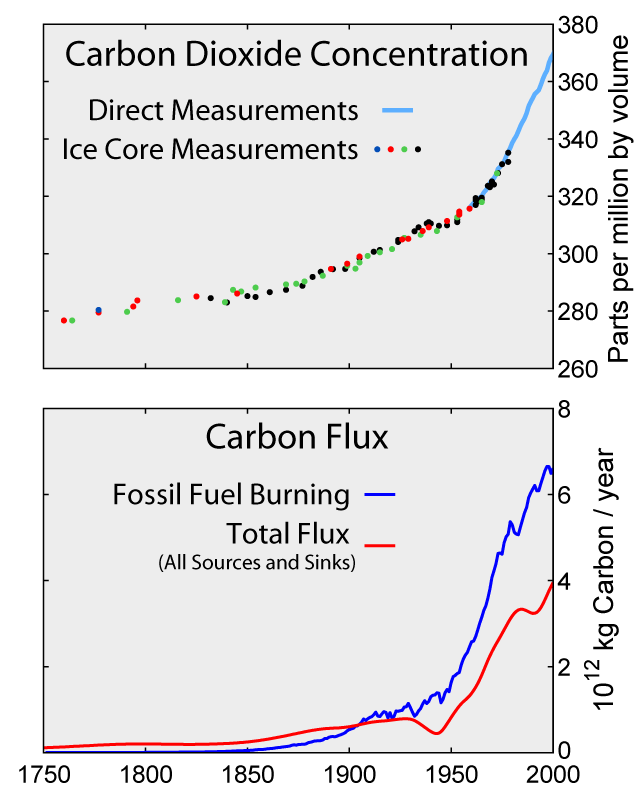
In 1750 there were about 280 part per million of carbon dioxide in
the atmosphere. Now it's about 380 ppm.
MIT scientists predict roughly 886 parts per million by 2095 in a
business-as-usual scenario - that's the median of a probabilistic
simulation described here.
So, by the century's end,
the the amount of CO2 in the atmosphere may almost quadruple
from its level before the industrial revolution.
How much will each doubling of the CO2 raise the Earth's
temperature? The long-term answer may be quite different from the
short-term answer, because there are feedback effects like the
ice albedo effect that take a while to kick in. A short-term estimate
is roughly 3°C. Long-term estimates could be more like 6°C:
The MIT study predicts a median of about 5°C of warming by the century's
end, with a 90% chance of warming between 3.5 to 7.4 degrees.
They call for rapid and massive action to avoid this.
February 25, 2010
In response to my mention of Hansen's 2007 estimate of
6° C 'long term' temperature increase in response to doubled
CO2, a correspondent writes:
I've always been skeptical about Hansen's claim of 6 C for long-term
sensitivity. This may be appropriate over the glacial-interglacial
cycles, in which there was a large ice-albedo feedback from vast
continental ice sheets in the Northern Hemisphere. However, since we
are in an interglacial, those ice sheets aren't there anymore. Thus,
we should expect a much smaller ice-albedo feedback under further
warming, even if the Greenland and West Antarctic ice sheets
disintegrate.
Hansen was still making his 6 C claim in this paper:
-
James Hansen, Makiko Sato, Pushker Kharecha, David Beerling, Robert Berner, Valerie Masson-Delmotte, Mark Pagani, Maureen Raymo, Dana L. Royer, James C. Zachos,
Target Atmospheric CO2: Where Should Humanity Aim?,
The Open Atmospheric Science Journal, 2, 217-231.
Abstract: Paleoclimate data show that climate sensitivity is
3°C for doubled CO2, including only fast feedback
processes. Equilibrium sensitivity, including slower surface albedo
feedbacks, is 6°C for doubled CO2 for the range of
climate states between glacial conditions and ice-free Antarctica.
Decreasing CO2 was the main cause of a cooling trend that
began 50 million years ago, the planet being nearly ice-free until
CO2 fell to 450 ± 100 ppm; barring prompt policy
changes, that critical level will be passed, in the opposite
direction, within decades. If humanity wishes to preserve a planet
similar to that on which civilization developed and to which life on
Earth is adapted, paleoclimate evidence and ongoing climate change
suggest that CO2 will need to be reduced from its current
385 ppm to at most 350 ppm, but likely less than that. The largest
uncertainty in the target arises from possible changes of
non-CO2 forcings. An initial 350 ppm CO2 target
may be achievable by phasing out coal use except where CO2
is captured and adopting agricultural and forestry practices that
sequester carbon. If the present overshoot of this target
CO2 is not brief, there is a possibility of seeding
irreversible catastrophic effects.
I've never quite followed the chain of logic in that paper completely.
He derives a slow-feedback of 6 C from the glacial-interglacial cycle
in Section 2.2. But the question is does that generalize to slow
feedback starting from a low-ice state? He argues that 35 My in the
Cenozoic is a good analog for that, but I don't see him actually
derive a number for slow feedback in Section 3.2. In Section 3.3 he
argues that "the equilibrium climate sensitivity ... is almost as
large between today and an ice-free world as between today an the ice
ages", which implies that you should still get a slow 6 C into a
future ice-free state. I guess I could sit down and try to verify
this from figures, but he doesn't show a calculation as far as I can
tell.
This paper was written in 2007 and published some time in 2008.
Interestingly, in December 2008 Hansen gave the Bjerknes Lecture
at the AGU fall meeting, with slides
here.
In these slides (see pp. 8-9), Hansen says that the empirical climate
sensitivity relevant to today's climate is "nailed" precisely to 3 C,
including paleo constraints. In the footnotes he notes that slow
feedbacks are sensitive to the climate state. And he doesn't mention
6 C anywhere in the lecture. Many have interpreted this as backing
off from the claim that the slow sensitivity relevant to a modern
interglacial climate is 6 C. But he doesn't come out and say it.
My question to you is, since you've read his new book, does he say
anything about very large slow feedbacks which are relevant to modern
climate (i.e., a 6 C climate sensitivity)? i.e., is he still pushing
this claim publicly? I would imagine that if so, he would put it in
his book somewhere, since he's been pounding the drum about extreme
climate risk (e.g., his runaway greenhouse stuff ... which he mentions
in his Bjerknes lecture, but using GISS modelE with a climate
sensitivity of something like 2.8 C, IIRC).
My answer: no, apparently Hansen is no longer pushing the 6° C figure.
On page 45 of his book:
Fortunately, Earth's history allows precise evaluation of climate
sensitivity without using climate models. This approach is suggested
by the fact that some feedback processes occur much faster than
others.
[...]
Using Earth's history, we can evaluate Charney's fast-feedback climate
sensitivity by comparing the last glacial period, 20,000 years ago,
with the recent interglacial period, the late Holocene. [...] We see
that the total forcing of about 6.5 watts maintained an equilibrium
temperature change of about 5 degrees Celsisus, implying a climate
sensitivity of about 0.75 degree Celsius for each watt of forcing.
This corresponds to 3 degrees Celsius for the 4-watt forcing of
doubled carbon dioxide. The sensitivity is smack in the middle of the
range that Charney estimated, 1.5 to 4.5 degrees Celsius.
From page 157:
Earth's temperature changed about 14 degrees Celsius between 50
million years ago and the recent ice ages. Between 50 and 34 million
years ago, the period when there were no large ice sheets on Earth, we
expect climate sensitivity to be 3 degrees Celsius for doubled carbon
dioxide (the empirical climate sensitivity we inferred earlier from
glacial-interglacial climate change).
I don't understand where higher sensitivity due to larger ice sheets
fits into his story here, and I don't even understand where the
fast/slow issue shows up. But the figure of 3 degrees, not 6, is the
one that keeps showing up.
Here's an online book about tipping points for climate change:
Since I live in Southern California, where a cycle of
drought,
bark beetle infestations, fires, and mudslides have been destroying
forests for about a decade now, I was particularly interested
in the section on
broad-scale forest die-back as a threshold response to
climate change in the southwestern United States. Here's a quote,
with references deleted to make it easier to read:
Currently, climate-induced dieback of woody plants is being recognized
as an important vegetation response to climate variation and change,
with examples of forest dieback emerging from around the world.
(It should also be noted that other recent studies have documented
increased tree growth in dry forests, perhaps because of increased
water use efficiency.) Recent research shows that water stress
appears to be driving increases in background tree mortality rates
in western North American forests. In addition, observations of
extensive tree die-off — especially from semiarid ecosystems
where woody plants are near their physiological limits of water
stress tolerance — are being documented globally, for example, in
Australia, Africa, west Asia, Europe, South America, and North
America. Climate-induced water stress over extended time periods
can exceed the physiological tolerance thresholds of individual
plants and directly cause mortality through either 1) cavitation
of water columns in the xylem conduits ("hydraulic
failure") or 2) forcing plants to shut down photosynthesis
to conserve water, leading to "carbon starvation".
These individual-scale threshold responses to climate stress can
trigger tree mortality that propagates to landscape and even regional
spatial scales, sometimes amplified by biotic agents (like bark
beetles) that can successfully attack and reproduce in weakened
tree populations and generate massive insect population outbreaks
with positive feedbacks that greatly increase broad-scale
forest mortality.
[...]
Although tree mortality almost certainly occurred across much of the
southwestern United States in response to the 1950s drought (and probably
for previous regional-scale droughts as well), few studies exist that
allow scientists to test projections about the rapidity and extent of
potential vegetation die-off responses to drought. A recent drought
beginning in the late 1990s and peaking in the early 2000s affected most
of the western United States. This was the most severe drought in the
Southwest since the 1950s. Substantial mortality of multiple tree species
has been observed throughout the Southwest during this 2000s drought.
For example, mortality of the piñon pine spanned major portions of
the species' range, with substantial die-off occurring across at least
1,000,000 hectares from 2002 to 2004. For both droughts, much
of the forest mortality was associated with bark beetle infestations,
but the underlying cause of dieback appears to be water stress associated
with the drought conditions.
The precipitation deficit that triggered the recent regional-scale die-off
of the piñon pine across the Southwest was not as severe (dry) as the
previous regional drought of the 1950s, but the recent 2000s drought
was hotter than the 1950s drought by several metrics, including mean,
maximum, minimum, and summer (June-July) mean temperature. Although
historic data from the 1950s is limited, available data suggest that
piñon pine mortality in response to the recent drought has been
more extensive, affected greater proportions of more age classes, and
occurred at higher elevation and wetter sites than in the 1950s drought.
Hence, the warmer temperatures associated with the 2000s drought may have
driven greater plant water stress through increased evapotranspirational
demand and resulted in more extensive tree die-off. Because global
change is projected to result in droughts under warmer conditions
(referred to as "global-change type drought") the severe
piñon pine dieback from the recent drought may be a harbinger of
vegetation response to future global-change type droughts.
In addition to the die-off of dominant overstory tree species, high
levels of dieback also were observed in other Southwestern U.S.
species and life forms in response to the warm regional drought in the
2000s. These include species where bark beetles are unimportant or
nonexistent, including one-seed juniper (Juniperus monosperma)
— a co-dominant with piñon pine for much of its range; shrubs
such as wavy-leaf oak (Quercus undulate) and mountain mahogany
(Cercocarpus montanus); and blue grama (Bouteloua gracilis),
the dominant herbaceous species in many of these woodland systems.
In addition to direct climate-induced mortality, severe protracted drought
also can cause substantial reductions in the productivity and soil
surface cover of herbaceous plants, which in turn affects numerous
other ecological processes. In particular, reductions in herbaceous
ground cover can trigger a nonlinear increase in soil erosion
once a threshold of decreased herbaceous cover has been crossed,
through increased connectivity of bare soil patches. On the other
hand, dieback of woody canopies tends to cause an immediate
successional shift toward greater cover of understory vegetation
if moisture conditions are adequate, which propagates a different set
of effects.
For more, try:
A quote:
Future drought is projected to occur under warmer temperature conditions as
climate change progresses, referred to here as global-change-type drought,
yet quantitative assessments of the triggers and potential extent of
drought-induced vegetation die-off remain pivotal uncertainties in assessing
climate-change impacts. Of particular concern is regional-scale mortality of
overstory trees, which rapidly alters ecosystem type, associated ecosystem
properties, and land surface conditions for decades. Here, we quantify
regional-scale vegetation die-off across southwestern North American woodlands
in 2002-2003 in response to drought and associated bark beetle infestations.
At an intensively studied site within the region, we quantified that after
15 months of depleted soil water content, >90% of the dominant, overstory
tree species (Pinus edulis, a piñon) died. The die-off was reflected
in changes in a remotely sensed index of vegetation greenness (Normalized
Difference Vegetation Index), not only at the intensively studied site but
also across the region, extending over 12,000 km2 or more;
aerial and field surveys confirmed the general extent of the die-off.
Notably, the recent drought was warmer than the previous subcontinental
drought of the 1950s. The limited, available observations suggest that
die-off from the recent drought was more extensive than that from the
previous drought, extending into wetter sites within the tree species'
distribution. Our results quantify a trigger leading to rapid,
drought-induced die-off of overstory woody plants at subcontinental
scale and highlight the potential for such die-off to be more severe and
extensive for future global-change-type drought under warmer conditions.
February 26, 2010
In 2008 the World Meteorological Organization
figured out the 10 warmest years since people started keeping
accurate records around 1850:
1. 1998
2. 2005
3. 2003
4. 2002
5. 2004
6. 2006
7. 2007
8. 2001
9. 1997
10. 2008
Now NASA reports that 2009 is tied for the second warmest
year since 1880!
Oz sent me this link to lots of pictures and animations of
the ocean's temperature:
-
National Oceanic and Atmospheric Administration (NOAA)
Satellite and Information Service,
Coral
Reef Watch.
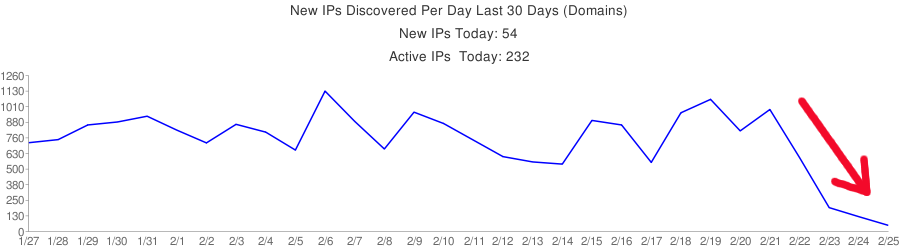
February 27, 2010
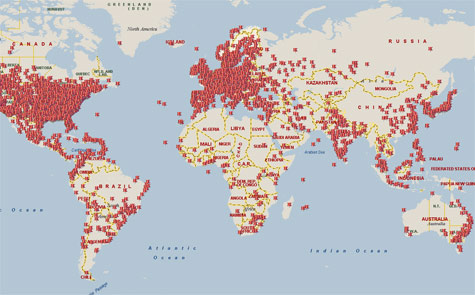 Map of computers infected by the Waledac botnet
in a recent 18-day period.
Map of computers infected by the Waledac botnet
in a recent 18-day period.
Picture from
Microsoft.
Microsoft got US courts to help
them launch an attack on the
Waledac botnet — an army of approximately 20,000 - 30,000
computers that seem to be controlled by
an outfit called
the Russian
Business Network, which specializes in spam, child pornography, malware,
phishing and various other forms of cybercrime.
Here's a graph of the number of
IP addresses infected by the Waledac botnet each day in the last month —
or at least the number newly discovered by the guys who keep tabs on
them:
A quote from Bright's article:
Botnets — large networks of malware-infected PCs remotely controlled
by criminals — are a serious problem on the Internet. The spam,
phishing attacks, and malware that these networks send accounts for a
massive proportion, in excess of 80 percent, of e-mail traffic. One such
network, known as Waledac, has been stopped in its tracks after Microsoft
got a court to issue a secret temporary restraining order. The restraining
order took 277 domain names used by the criminals to communicate with the
botnet offline. Without these domain names, it is hoped that the controllers
of the botnet will permanently lose access to the machines running their
malware.
The Waledac botnet is presumed to be run by Eastern Europeans and to be made
up of hundreds of thousands of compromised machines. It sends hundreds of
millions, if not billions, of e-mails each day, as well as distributes
malware to help recruit new machines to the network. Microsoft's complaint
describes in detail how the botnet is organized, with a complex hierarchical
control system. At the root of the system is the command-and-control servers.
The botnet uses the 277 domain names to connect to the command and control
servers to download new commands. These commands are then distributed through
the different tiers of the network using peer-to-peer transmission.
By obtaining the restraining order, this command-and-control system was
disrupted; with the domain names offline, the machines in the botnet were
no longer able to locate their control servers, rendering them mostly
harmless. The court action had to be taken in secret to avoid warning the
botnet's operators; with sufficient warning, they might have been able to
set up new domain names and new control systems, thereby circumventing
Microsoft's efforts. The names have now been offline for three days,
presumably sufficient to cause permanent disruption, and the injunction
is now public.
Similar action against past botnets has been attempted by security
researchers before, but the results were only temporary as new command
and control servers were set up. Microsoft's intent is for this action
to be more permanent. "Operation b49," as Redmond has called
it internally, still has further work to do to ensure that the
peer-to-peer communication between computers in the botnet is disrupted.
February 28, 2010
A lot more rain yesterday! But today the sky is utterly clear.
I'm getting ready to start a new blog that talks about what mathematicians
and scientists can do about the really big issues of our day: climate change,
the mass extinction event, and so on. I want people to understand what
I'm saying... so these tips are handy:
For
my March 2010 diary, go here.
Gone.
Gone.
Through crumbled fingers gone.
Can never be recollected. - Brian Eno
© 2010 John Baez
baez@math.removethis.ucr.andthis.edu