Blowing down from the Northwest through the Rocky Mountains, it slammed into the Midwest from Michigan all the way down to Texas, where some roads were covered with ice and up to 7 inches of snow. More than 400 hundred flights were canceled at Chicago's O'Hare Airport, and 200 at Dallas-Forth Worth. Further north, some areas are getting 2 inches of snow per hour! Tonight fierce winds will hit New England.
Meanwhile it's chilly down here - chilly for Southern California, anyway. Not really cold at all. But last night, I curled up in bed and read about the end of the last Ice Age. I find this tremendously romantic, because it paints a portrait of a land recognizably like our own, but strangely different:
Written by one of the founders of mathematical ecology, it reads like a novel, with nary an equation.
Let me set the stage with some dates. The last Ice Age - the Wisconsin glaciation, began in about 70,000 BC. The oldest known cave paintings date back to 32,000 BC. The glaciers reached their maximum extent about 18,000 BC, with ice sheets down to what are now the Great Lakes. In places the ice was over a mile thick! That's 1.6 kilometers for you metric folks.
Then it started warming up. By 16,000 BC people started cultivating plants and herding animals. The first known people in the Americas date back to about 11,500 BC - they're called the Clovis culture. By about 10,000 BC the Ice Age had ended. The first cities in the Old World date to around 7,500 BC; cities in the Americas seem to come much later.
At the time of maximum glaciation, there were three main refuges for life in North America. Biologists call such things "glacial refugia". The first was all the land south of the glaciers, including an "ice-free corridor" just east of the Rocky Mountains. The second was Beringia, a huge region made of what's now Yukon and Alaska, together with eastern Siberia. As you can see, the ocean was lower when more water was frozen up in glacier and the ice caps:
The third was the coastal plain region of eastern America, which is now submerged to form the continental shelf off the coast of New England and Canada.
Besides these big refugia, there were also smaller coastal refugia and nunataks - mountains too high for the glaciers to cover them!
What was life like south of the ice sheets around 16,000 BC? In the eastern half of the continent there was tundra and spruce forest. Further west it was drier, except for a belt that got runoff from melting glaciers. West of what is now Minnesota it was too dry for forests - just grasslands. And where the Great Plains now reign supreme, there was a huge area of sand dunes!
There were many large mammals. Largest of all were the American mastodon and four species of mammoths, only two of which survived to the end of the ice age: the woolly mammoth in the tundra of Beringia, and the much larger Jefferson's mammoth in the central plains and the west. Both these went extinct around 9,000 BC, perhaps killed off by humans. Bones from butchered mammoths have been found with Clovis spear points in Wyoming and South Dakota.
There were giant beavers, 2.5 meters long and 220 kilograms (485 pounds) in weight. There were also giant ground sloths.
There was also the Mexican horse and western camel, both now extinct. Recently people have found spearheads dating back to 8,300 BC bearing protein residue from the Mexican horse! Indeed, this horse may have been hunted into extinction. Early Americans also hunted the western camel in Wyoming, as recently as 8,000 BC, which is around when they died out.
Caribou and tundra muskox ranged far further south than they do today. The tundra muskox probably crossed into Beringia around 90,000 BC. There was also a species of woodland muskox, now extinct. The elk, white-tailed deer, mule deer, bison and bighorn sheep that we know today were already widespread. But there were apparently no moose, except in Beringia.
But I know what you're wondering: what about carnivores?
The familiar cougars, bobcats and black bear were already here. Timber wolves were present but uncommon. Grizzly bears reached midlatitude America only after the ice sheets began to melt. But there was also the dire wolf, similar to the modern wolf but bigger and stronger. There was the sabertooth, about the size of a lion, with incredible teeth. There was its smaller relative, the scimatar cat... and the American lion, and the American cheetah! All these are gone.
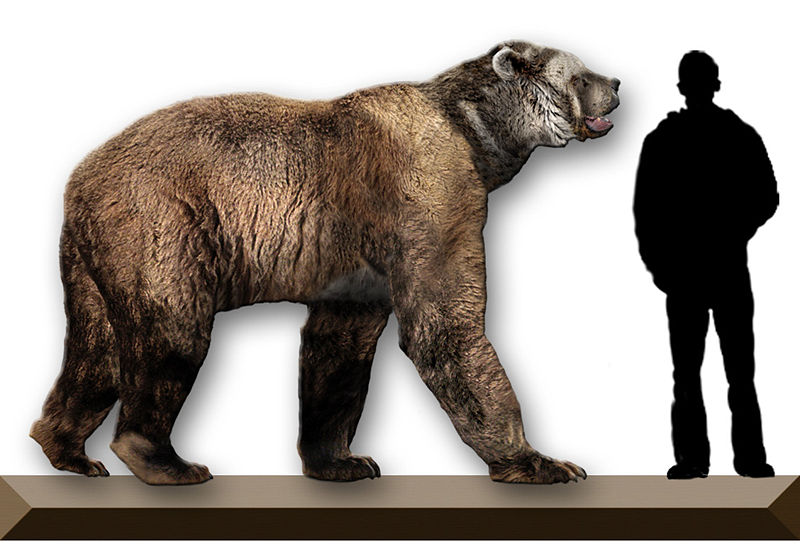
And then, there was the giant short face bear. This was the most powerful predator of the lot: a flesh-eater with powerful jaws, and probably quick on its feet, able to run down prey. It stood 1.6 meters (5.5 feet) at the shoulder. It weighed about 900 kilograms (almost a ton). You would not want to meet one of these:
For more on the Ice Age, see my
October 22 entry.
December 2, 2006
I recently mentioned the rise of relationships conducted over the phone. But did you know that over a million people live part of their lives in a 3d virtual reality environment called Second Life? This is run on a computer network called the Grid: hundreds and hundreds of servers, each of which simulates 64,000 square meters of land. People rent this land, starting at $5 per month for the bare minimum area, 512 square meters. There is also an initial fee, which for this minimum unit is between $10 and $25. But, many people own whole islands and pay $3,000 a year!
Some companies are starting to hold conferences on the grid. They've got their own antique bookstore in there:
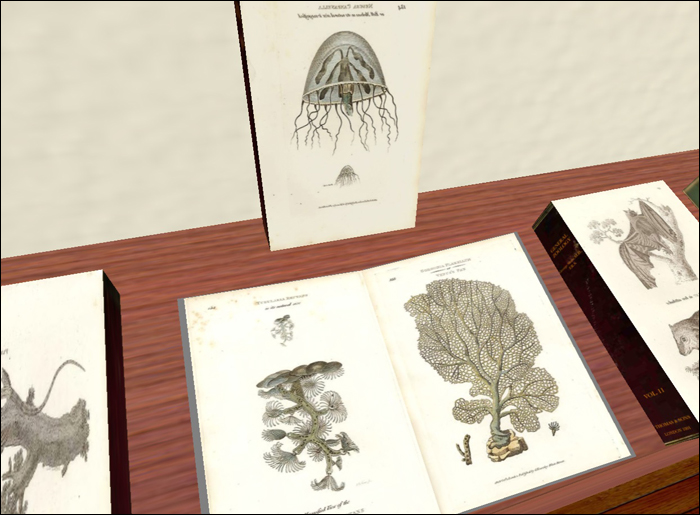
their own art galleries:

their own blogs, their own steam-powered skates (huh?), and everything!
You can get a bit more sense of what Second Life is like by reading or watching these:
In October 2006, the Grid was overrun by self-replicating grey goo. So, the worst nightmare scenario in nanotechnology came true - but in virtual reality, thank goodness. They were able to fix it pretty quick.
You can tell we're heading
for a technological singularity, when weird stuff like this is going on
and lots of people don't even hear about it!
December 5, 2006
Here's a useful corrective to the above gee-whiz remark
about a technological singularity, by
Greg Egan:
Hi JohnI could try to explain what I "really meant", but I don't think really meant anything - I was just in awe of this Second Life stuff, a kind of technofantasy coming true before I expected it, without me even noticing.
Thanks, that's interesting. New Scientist (which, honestly, is interesting quite often, when they stay away from magic anti-gravity devices) had a story a few months ago on the growing economies of online worlds, and the growing presence of more serious crime now that virtual money can be exchanged for real money in some of them.If you don't already know about this, you might find it interesting: http://math.ucr.edu/home/baez/diary/december_2006.html#december2.06None of this makes me believe in an imminent technological singularity, though, unless you define it in the "weak" sense of "strange things happening that almost nobody predicted", in which case we've had lots of them already. What I'm extremely sceptical about is the idea that we're on the verge of writing self-improving software, which will inspect itself and modify itself (and eventually its physical substrate) in ways that will lead to an exponential increase in its speed, efficiency and capabilities; in other words, we'll just "light the fuse" and then some spectacular new form of intelligence will arise. We might be on the verge of various stupid mistakes that wreak havoc on the internet, and within a few decades of even stupider mistakes that could wreak havoc on the real world, but I don't count either kind of disaster as a singularity ... it's only a singularity if the grey goo starts talking to you.
This doesn't really refute anything singular-esque, but you might be amused to know that it took the people responsible for Java eight years to regain the ability to draw circles; this used to work fine in their early version, but then they added lots of fancy complications to their graphics routines, and circles proved to be just too hard to get right:
- Sun Developer Network, Bug ID: 4151279: Curves are not as pleasing as JDK 1.1 (affects ovals, arcs and roundrects)
Best wishes
Greg
Last night I got a nasty stomach flu, which has now died down to a fever
and general weakness and malaise. Tomorrow I fly for Stanford, where I'm giving
a math talk
the next day, so I'd better go to bed early now. After my talk I'll go out
to dinner with the mathematicians and also
Eric
Drexler - the nanotech guru, who works at the
same company as my pal
Bruce Smith. Eric's wife
Rosa Wang
will also be there. I've never met them. It should be interesting.
December 6, 2006
About the above Singularity stuff, Kevin
Kelly wrote:
John,It's indeed an interesting piece, in part because it clarifies the feeling I had when I said "You can tell we're heading for a technological singularity, when weird stuff like this is going on and lots of people don't even hear about it!". It suggests that people have been feeling this a bit for a long time, and could keep on feeling it for a long time, without there necessarily being a moment at which the intensity of new weirdness becomes infinite: a moment of complete rupture, or Rapture.
I've been enjoying your diary. Concerning skepticism on the singularity, here's a small piece I wrote a while back. You may find it of interest, though no doubt it is not rigorous mathematically:
(Ray Kurzweil responds in the comments.)
- Kevin Kelly, The singularity is always near.
--
-- kk
To be good scientists we really should save the term "singularity" for a point at which something become infinite. Kelly wisely points out that there doesn't need to be a moment like this coming up, even if change is growing faster, and the rate of change of change is growing faster, and so on. Exponential growth will suffice!
There's a lot more to say about this - stuff about phase transitions and the like - but I'm too tired right now.
(By the way, I'm starting to quote more emails in my diary.
If you're considering mailing me, don't be afraid that
I'll just stick your email into your diary. If I want to do it,
I will ask permission first.)
December 7, 2006
My talk at Stanford
went okay, but certainly didn't leave them cheering in
the aisles. The dinner was small, with just Rafe Mazzeo, Eric
Drexler and Rosa Wang. A great conversation, and sometime soon I
should try to write down a few things I learned, before I forget them
all - I've already forgotten half.
December 8, 2006
I took Caltrain from Palo Alto up to San Francisco, where
Bruce's wife met me and drove me to their home in San Rafael.
December 10, 2006
I would like to continue my tale of life in North
America after the last Ice Age, but I failed to bring
After the Ice Age up here to Bruce's house. Kevin Kelly pointed
out this book:
December 11, 2006
On October 7th and
October 9th I discussed
the Paleocene-Eocene Thermal Maximum. This was a sudden spike in
temperature 55 million years ago, in which global temperatures shot up
5-8° C for a few thousand years. You can see it here - it's labelled
"PETM":
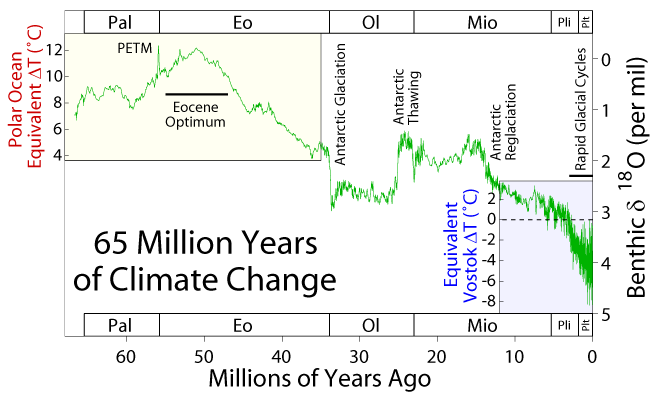
I mentioned some new evidence that the the PETM was due to a sudden release of greenhouse gases - in particular, a "methane burp" where methyl hydrates on the sea floor suddenly got loose into the atmosphere. It seems worth studying, since it may be the closest natural analogue of the burst of global warming we are suffering now!
My friend Bruce Smith subscribes to lots of science magazines, so I happened to bump into some articles that are relevant - especially the second one here:
Declining atmospheric CO2 has long ben envisaged as a culprit for the past 55 million years of cooling climate, and the consequent transition from an ice-free world to one with large ice sheets on Greenland and a frozen Arctic, as well as with a deep-frozen Antarctica. Indeed, reconstructions of past atmospheric CO2 concentrations, based on isotopic markers from marine algae, show a dramatic drop in atmospheric CO2 between about 45 million and 25 million years ago that corresponds quite well to the onset of major global cooling. However, although the onst of glaciation and sea ice in Antarctica about 43 million years ago matched the onset of global cooling and CO2 decline, the Artic seemed to march to a different drummer. Arctic cooling [...] seemed to hold off for tens of millions of years, until about 2-3 million years ago, when pebbles carried by icebergs first appeared in North Atlantic sediments.In fact, Sluijs et al looked at sediments in a formation called the Lomanosov Ridge in the center of the Arctic Ocean. They could tell which sediments formed during the Paleocene-Eocene Thermal Maximum by seeing an abundance of fossils from tiny sea creatures that normally like subtropical oceans. In the organic material in these sediments, they saw a 2.5% decrease in carbon-13 concentrations at the time of the PETM. Since carbon-13 is a radioactive isotope made when carbon dioxide in the atmosphere gets zapped by cosmic rays, this suggests that a bunch of new carbon from deep below was released at this time! The obvious candidate is a methane burp.[...]
The puzzle is solved nicely with the new record reported by Moran et al, which shows Arctic ice developed much earlier than previous developed. Pebbles carried to the middle of the Arctic basis by icebergs appear by 45 million years ago, about the same time as around Antarctica.
Sluijs et al report that 55 million years ago Arctic summertime surface-ocean temperatures were as high as 18° C. Such temperatures are comparable to those of the modern summer ocean on the French coast at Brittany (where hardy souls even go swimming). More importantly, climate models for 55 million years ago don't even come close to simulating such warm waters, even when reflective ice sheets are left out and atmospheric CO2 levels are pumped up to 2,000 parts per million - nearly ten times the levels before the Industrial Revolution. [...]
Slujis et al also provide intriguing results for a dramatic burst of intense warming - the Palaeocene-Eocene Thermal Maximum - that occurred 55 million years ago. This 'Palaeocene supergreenhouse' is believed to have been caused by a massive release of carbon to the oceans and atomosphere, either from methane present in deep-sea sediments or as organic carbon vaporized by volcanism during the opening of the North Atlantic Ocean. In either case, the extra CO2 in the atmosphere increased the greenhouse effect and warmed tropical temperatures by 4-5° C. Sluijs et al show that Arctic temperatures also soared, rising from 18° C to 23° C.
How much is "a bunch" of carbon? At least 1.5 × 10¹⁵ kilograms, or in other words, 1.5 trillion tons! This is as much as all the current and expected carbon released by our use of fossil fuels!
So, from this ancient history, we may get some idea of the future effects of our current fossil fuel usage.
In related news, NASA scientists now think the Arctic Ocean will be completely
ice-free
during summertime by 2040.
December 12, 2006
Following up to his message of
November
6th, Tony Smith writes:
Of the four carrier groups that were last month (November 2006) in
the Persian Gulf and nearby waters:
Enterprise, Eisenhower, Iwo Jima, and Boxer
two have returned home:
Iwo Jima arrived in Norfolk today (6 December 2006)
and
Enterprise is also home.

From an article dated 2 December 2006 on the web at
http://www.strategypage.com/dls/articles/2006122232136.asp:
"... The American carrier USS Enterprise recently returned
from 30 weeks at sea. It was an unusual voyage, ...
seeing combat in both Iraq and Afghanistan.
Enterprise aircraft only dropped four bombs in Iraq,
while dropping 133 in Afghanistan ...
In Iraq, aircraft spent nearly all their time doing recon,
or electronic warfare (zapping roadside bomb detonators,
or searching for enemy transmissions.)
One unusual aspect of this voyage was that no one was killed.
Normally, there is at least one death on a deployment that long. ...".

So, it seems that the 4-carrier deployment did not result in
any major attack related to Iraq/Syria/Iran,
which is consistent with the position of the USA Baker-Hamilton group
as described by a DEBKA article at
http://www.debka.com/headline.php?hid=3601
which said about that report:
"... Four significant changes are indicated:
1. The US finds itself unable to prevent or respond to an Iranian nuclear
attack on Israel, as incoming defense secretary Robert Gates stated bluntly
in the Senate committee hearing Tuesday.
2. American forces will be gone from Iraq in just over a year.
3. Washington will soon embark on a fresh Israeli-Palestinian peace initiative.
4. Direct US-Iran, US-Syria talks are in the offing. ...".

I hope that the fact that there were no deaths during the Enterprise
deployment is a good omen.

Tony
I last talked about the Fermi paradox in my October 27th entry. Bruce's main idea here is that there's so much uncertainty in all the variables in the Drake equation that we might as well just admit the possibility that our Earth is the first civilization in our past lightcone to be able to send signals for really long distances at the speed of light (radio, television). Given this, we can put an upper bound on the density of such civilizations. There are a lot of interesting calculations to be done here - but not today.
What about the Gaia Hypothesis? This says that life on Earth serves to regulate the Earth's temperature, rainfall, and the concentration of various gases in the atmosphere and minerals in the ocean - keeping them all at conditions suitable for life. In short, life serves as a homeostatic mechanism, like a thermostat keeps your house from getting too warm or cold.
This hypothesis might explain, for example, why the Earth's temperature has not increased since life started. In 3.5 billion years the Sun will become 40% brighter than today - hot enough for the Earth's oceans to evaporate. But in fact, the Sun is getting bigger and brighter already, and now it puts out 25% or 30% more light than it did when life began. However - the Earth hasn't gotten any hotter during this time! Could life on Earth be regulating the temperature somehow?
It's a nice thought. The first problem is: how could life act to maintain optimal conditions in the Earth's overall environment?
To tackle this problem, the original proponent of the Gaia Hypothesis, James Lovelock, proposed a simple toy model called Daisyworld. In this model, white daisies thrive when it gets hot, while black daisies thrive when it gets cold. So, when it gets hot, white daisies spread, which bounce more sunlight back into the atmosphere and cool things down. When it gets cold, black daisies spread, which retain more energy from the sun and warm things up! So, they serve as a kind of thermostat.
This is fine as far as it goes, but one can imagine another world where black daisies thrive when it gets hot, while white ones thrive when it gets cold! Here any heating or cooling would get amplified by the presence of life, instead of counteracted.
Of course it's better for everyone if life serves to counteract disturbances in the environment rather than amplify them. But this isn't enough to justify the Gaia Hypothesis. Just because homeostasis is good for life as a whole doesn't mean any individual organism will do its part to create homeostasis - unless somehow it confers a significant competitive advantage to that particular organism. (We're being hard-headed evolutionary biologists here, not mystics.)
In short: what selection pressure could push organisms to maintain optimal conditions in the Earth's overall environment?
Bruce provided a simple possible answer. Let's consider the example of temperature again. It's easy to see how each individual organism gets an advantage from cooling itself down when it gets too hot, or warming itself up when it gets too hot. What's a good way to cool down? By being white, and reflecting sunlight! What's a good way to warm up? By being black, and absorbing it! So, it might really be to the daisy's individual advantage to be white if it's too hot, or black if it's too cold.
There are lots of questions left, of course. First of all, there's the question of whether this really happens. When Bruce told me his idea, I joked "So that's why polar bears are black!" In fact, many Arctic creatures are white. Clearly the advantage of being well hidden in the snow outweighs the advantage of absorbing some extra sunshine during the day. And, as Bruce pointed out, one must also consider nighttime: being good at absorbing radiation of a certain frequency in the day also means being good at emitting it at night. (But, we can easily imagine a creature that's good at absorbing visible light and bad at emitting infrared - this would be the best way to keep warm during both the day and night.)
Actually, if we're serious about looking for homeostatic mechanisms, we should look not in the Arctic - the color of polar bears couldn't possibly have much of an effect on global climate - but in forests and grasslands. Plants cover large portions of the Earth, and they could have a significant moderating effect on the climate. In fact it's known that they do! One can imagine survival-of-the-fittest reasons why each individual tree would do well to regulate the temperature in its neighborhood; then, when you have a whole forest of them, the effect gets dramatically multiplied.
It would be interesting to see if this kind of effect can really justify the Gaia hypothesis. I should read these:
Before dropping Jim off at the airport, we stopped by Chris Lee's house, since Chris had a spare laptop for Jim to use. Now I'm back at Chris' house; I'll spend the night here and pick up Lisa at the airport next morning... she's coming back from Shanghai!
As usual when I visit Chris and his wife Menakshee, I've been bombarded with lots of interesting books and new ideas. This time I'll try to list some before I forget.
I like this equation of Kelly's:
Gmax = S
Here Gmax is the maximum expected growth of a gambler's money, while S is the amount of "inside information" the gambler has - information that other people don't have.
Gmax is measured logarithmically: let me explain with an example. Suppose the gambler has a strategy that on average allows him to multiply his money by a factor of 8. Then his Gmax is defined to be
log2(8) = 3
We use base 2 here for a simple reason: we measure S, the amount of inside information, in bits!
Kelly's equation
Gmax = S
implies that if a gambler's S is 3, his Gmax is also 3. So, if a gambler receives three bits of information, he can find some trick which on average multiplies his money by 23 = 8. Here the "average" is a geometric mean, not an arithmetic mean.
To get a feeling for why Kelly's theorem is true, it's best to start with the simplest example. If R = 1, then Gmax = 1 = log2 2. So, if a gambler receives one bit of inside information, he can double his money!
This sounds amazing, but it's also obvious. Suppose you have one bit of inside information: whether a flipped coin will land heads up or tails up. Then you can make a bet with someone where they give you $1,000,000 if you guess the flip correctly, and you give them $1,000,000 if you guess wrong. This is a fair bet, so they will accept. That is, they'll think it's fair if they don't know you have your inside information! Since you do have this information, you'll win the bet, and double your money on this coin flip.
I like this relation between information theory and gambling, in part because one stream of Bayesian probability theory says probabilities are subjectively defined in terms of what bets you would accept. This is justified by something called the Dutch book argument.
So, there's a deep relation between gambling and probability - no news here, really. But, there's also a deep relation between probability and information theory, discovered by Shannon. Briefly, it goes like this: the information you obtain by learning the value of a random variable is
S = - ∑i pi log2 pi
where the sum is taken over the possible values of this random variable and pi is the probability that it takes the ith value. So, for example, if you flip a fair coin, where p1 = p2 = 1/2, the information you get by looking at it is
-[1/2 log2 (1/2) + 1/2 log2 (1/2)] = 1
One bit!
So: gambling is related to probability, and probability is related to information. Kelly's result closes the circle by providing a direct relation between gambling and information!
But, apparently some of Kelly's ideas are still controversial in the world of economics and stock trading. I'll have to read Poundstone's book to learn why.
Next:
Right now Chris is trying to understand natural selection from an information-theoretic standpoint. At what rate is information passed from the environment to the genome by the process of natural selection? How do we define the concepts here precisely enough so we can actually measure this information flow?
Chris pointed out an interesting analogy between natural selection and Bayesian inference.
The analogy is mathematically precise, and fascinating. In rough terms, it says that the process of natural selection resembles the process of Bayesian inference. A population of organisms can be thought of as having various "hypotheses" about how to survive - each hypothesis corresponding to a different allele. (Roughly, an allele is one of several alternative versions of a gene.) In each successive generation, the process of natural selection modifies the proportion of organisms having each hypothesis, according to Bayes' law!
Now let's be more precise:
Bayes' law says if we start with a "prior probability" for some hypothesis to be true, divide it by the probability that some observation is made, then multiply by the "conditional probability" that this observation will be made given that the hypothesis is true, we'll get the "posterior probability" that the hypothesis is true given that the observation is made.
Formally, the exact same equation shows up in population genetics! In fact, Chris showed it to me - it's equation 9.2 on page 30 of this book:
Now, instead of a "prior probability" for a hypothesis to be true, we have the frequency of occurence of some allele in some generation of a population. Instead of the probability that we make some observation, we have the expected number of offspring of an organism. Instead of the "conditional probability" of making the observation, we have the expected number of offspring of an organism given that it has this allele. And, instead of the "posterior probability" of our hypothesis, we have the frequency of occurence of that allele in the next generation.
(Here we are assuming, for simplicity, an asexually reproducing "haploid" population - that is, one with just a single set of chromosomes.)
This is a great idea - Chris felt sure someone must have already had it. A natural context would be research on genetic programming, a machine learning technique that uses an evolutionary algorithm to optimize a population of computer programs according to a fitness landscape determined by their ability to perform a given task. Since there has also been a lot of work on Bayesian approaches to machine learning, surely someone has noticed their mathematical relationship?
After a day of talking (and working - it took quite a while to write up the above stuff), we ate out at M & M Soul Food in a jazzy neighborhood called Leimert Park. Being Tuesday, it wasn't actually so jazzy - at least not as far as we could see. But, the catfish was good, as were the black-eyed peas!
Later we went to a great video store called
Cinefile, which specializes
in the most obscure movies. Wanna see a Turkish remake of Star Trek,
or the Wizard of Oz? They've got it! And they've got movies organized by
categories... including some really specialized categories, like
"Big Goofy Monsters" or "Burly Babysitters". We
wound up watching an 1931 Frank Capra comedy called
Platinum Blonde -
only so-so, but fun in its way.
December 20, 2006
Lisa is back! She's unpacking wads of cool stuff from China
while I blog away, sitting on the bed...
December 21, 2006
It's the Winter Solstice - the shortest day of the year!
Here in Riverside, the Sun rose at 6:54 am and set at 4:47 pm,
so the day was 9 hours and 53 minutes long. Up in San Francisco,
where I was not long ago, the sun rose at 7:21 am and set at 4:53
pm (hmm - later!), so the day was 9 hours and 46 minutes long.
Just a small difference - I was curious about that.
But it's a lot less cloudy here....
We bought a transformer for the printer Lisa bought in Shanghai - we got it at a great store called the Electronics Warehouse, located on Main Street north of downtown Riverside: the part of town where all the really practical stores are, like auto body shops, machine shops and metal supply shops. Nowadays Radio Shack tries to makes its money selling cell phones, and the kids who work there don't know an amp from an ohm. But at the Electronics Warehouse, the salesman talked to us knowledgeably and entertainingly for 20 minutes about which wattage transformer to buy for a laserprinter! By the end, I could draw a graph showing how much power a laserprinter sucks up from the time you turn it on to the time it's hot and ready to print.
The place was full of connectors, adaptors, cables and components,
all neatly labelled and displayed. I'll never go to Radio Shack again.
December 22, 2006
In the morning I
worked with Derek Wise on
a paper we're writing with Jeffrey Morton, Laurent Freidel, and
Aristide Baratin. This paper is about representations of the Poincaré
2-group, a gadget I invented
a while back.
These representations have already been studied by
Crane and Sheppeard,
but there's a lot left to do with them.
In the afternoon I started polishing the version of my
Lectures on Classical Mechanics that
Blair
Smith kindly typeset for me - out of the blue!
I'm hoping this will be the start of a trend. I've got a
lot of lectures that I'd like to turn into
books, but I'll never do it alone. I offered to make Blair a coauthor,
but so far he has modestly refused, even though he wrote a lot of
text when turning Derek Wise's handwritten
notes into a typed manuscript.
December 23, 2006

As Christmas approaches and thousands of people are stuck in a blizzard in Denver Airport, I feel like talking more about ice.
One of the strangest features of North America at the end of the last Ice Age were the large regions of "stagnant ice". As the glaciers retreated, ice became buried by sediments called glacial till and wind-borne dust called loess. The ice was thick and well insulated, so it lasted for a long time. For example, in North Dakota there was a 60-kilometer wide zone of stagnant ice. It started out being as much as 100 meters thick! It lasted from 10,000 BC to 7,000 BC. The signs of its presence are still visible now.
Quoting from After the Ice Age:
The ice in stagnant ice terrain was for the most part buried deep, too deep for it to influence the environment on the surface. But this was not the case everywhere. There were occasional thin spots or even gaps in the insulating drift blanket, and here the ice began to melt. It melted in summer sun and dissolved in summer rain. Meltwater and rainwater together must have formed rivulets that drained into crevasses and then spread laterally, eroding a network of tunnels and caverns in previously insulated ice. Even while forest was in the process of developing over much of the area, the ground was crumbling here and there, where the stagnant ice had become honeycombed and weak around the thin spots and where cavern roofs caved in.At the surface, the scene was one of sudden subsidences of the ground where the ice had given way beneath. Patches of forest sank into hollows, drowing the terrestrial plants. Much of the forest was "drunken forest," with trees leaning in every direction owing to the instability of the ground. On a small scale, the topography was continually changing. Sometimes the slumping exposed a cliff of ice, which would begin to melt as soon as it was exposed to sunlight and air. Innuerable little superglacial puddles and pools were formed because of the subsidences. They were icy cold and probably, like glacial lakes today, milky with rock flour; as environments for life, they were unpromising.
The continued melting of the ice where it was poorly insulated improved insulation. The negative feedback process that allowed melting ice to slow its own melting worked as follows: the ice was "dirty," with embedded rocks (how dirty is not known), and as the surface gradually sank lower at the thin spots because of melting, the rocks were released from their icy matrix and acuumulated. Thus, in time, the thin spots in the original insulation automatically repaired themselves, and the melting slowed considerably. The insulation was also augmented everywhere by wind-borne dust from the zone of newly exposed land next to the ice sheet margin (which was not far away to begin with) and by accumulating forest floor litter, humus, and soil.
[...]
It is known from studies made in Alaska that a drift layer two meters thick insulates surface lakes from buried ice completely.
Gradually the insulation became absolute. Gradually the terrain became less active in the sense that slumps and subsidences became less and less frequent. The melting of the buried ice (which continued to melt, of course, or it would be there still) came to be caused entirely by the earth's internal heat. And meltwater from the buried ice contributed progressively less to the lakes until they were supplied entirely by precipitation.
[...]
Stagnant ice terrain finally ceased to exist when the last of the buried ice melted, about 9k B.P. [that is, 9000 years ago, or 7000 BC]. At first, lakes that had been superglacial were led down onto bedrock, becoming so-called ice-walled lakes for as long as the surrounding ice remained. The last blocks to melt left the holes occupied by modern prairie potholes. All the land surfaces gently collapsed, because of the disappearance of the ice that had supported them. The lowered land levels allowed the ice-walled lakes to drain, and their sediments, which had accumulated layer upon layer to a considerable thickness, were left high and dry as flat-topped hills.
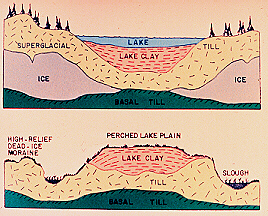
By the end of the melting period, at about 9k B.P., a reversal of the original topography had taken place, so that the fossils of lake-dwelling organisms are found on what are now hill tops.
The world is constantly changing in unexpected ways!
December 24, 2006
A mysterious plumbing crisis - the water backed up in both
bathrooms, spilling out the toilet onto the floor in one.
We called Roto-Rooter and the fellow couldn't find anything
wrong!
The rest of the day was spent dusting and vacuuming the master bedroom,
the associated bathroom, and the Poetry/Science Fiction Libary.
December 25, 2006
A low-key Christmas. We opened presents, had breakfast, called my
parents and sister in Virginia, and my aunt in Pasadena. I wrote
This Week's Finds while Lisa
copied the instructions for several tai chi forms from
VCDs to MP3s.
We had homemade pizza for dinner - a kind of tradition I haven't engaged in for months, since only Lisa has the energy to make the crust from scratch, though it's easy with a bread machine. And, we watched the first two episodes of Star Trek: The Next Generation. Lisa bought DVDs of the entire show in Shanghai - it'll be fun to see the whole thing in order, without commercials.
I guess they call it "domestic bliss".
December 26, 2006
It's Boxing
Day! When I was a kid I used to think
this was an obscure British holiday where people pummeled their relatives
after too much Christmas stress.
An earthquake has cut off China's internet access to the rest of the
world - see below.
December 27, 2006
The Bush administration is considering listing the polar bear as a threatened species. As the Arctic melts, polar bears are starving and drowning as they need to swim longer and longer distances between ice floes. There are even reports of cannibalism. There are between 20,000 and 25,000 polar bears in the world, with about 4,700 in Alaska. Their population has declined about 20% since 1990.
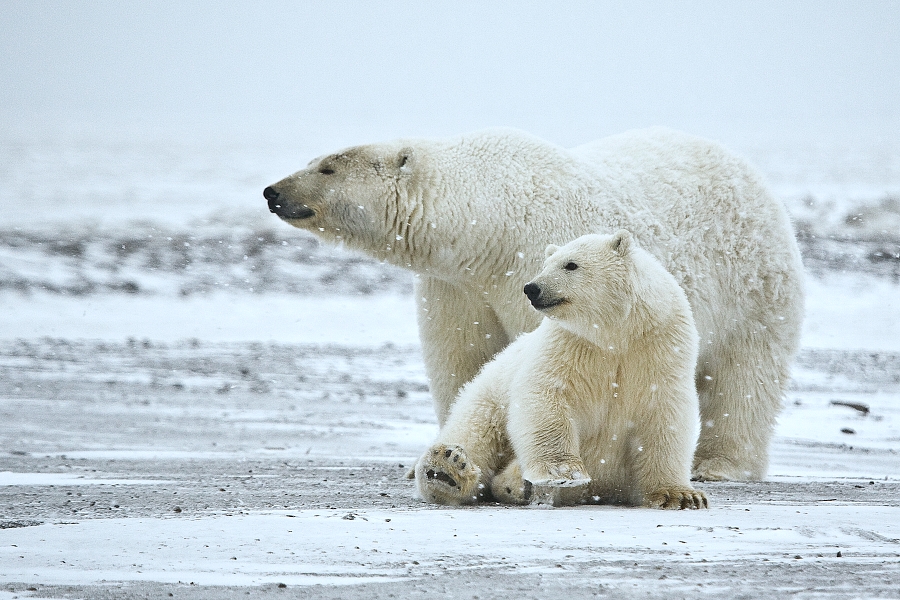
The polar bear would be the first animal to be listed as threatened
due to global warming. If it's listed, this would
require government agencies to take no action that threaten it further.
But, the Bush administration has said there would be no new curbs on
oil drilling in Alaska or limits on greenhouse gas emissions.
December 28, 2006
Now that everyone is talking about Ethiopia's war against the
Islamic
Courts Union in
Somalia, I can't
resist pointing out that I discussed the Islamic Courts Unions
June
13th. These news stories start as tiny newspaper items
and then blossom "all of a sudden" into public visibility.
If my diary often seems alarmist, it's because I like
to spot worrisome trends while they're still small.
I'm not sure why - it's not as if I'm actually able to do
anything about most of these trends. I just like to "stay on
top of things".
Having spent the summer in China, heavily reliant on broadband internet to feel connected to the world, this story fascinates and appalls me:
A National Public Radio reporter in Shanghai did a story on this disaster which contains an interesting nugget of information. The Chinese government has recently blocked the NPR website! When Lisa and I were in Shanghai, we listened to National Public Radio news on the computer every morning.Asia's Earthquake-Inspired Internet Blackout
John Berthelsen
Asia Sentinel, December 28, 2006
Another devastating Boxing Day earthquake exposes the lack of infrastructure depth in Asia
At this point nobody seems to know how long it will take to restore normal service. Estimates go as long as three weeks. Verizon, the international communications giant which is responsible for some of the cables, said it could take as long as five days to even get a cable ship into the earthquake region. The cables themselves are at about 3,400 meters below the ocean floor, meaning submersibles can't get to them. Surface ships must search for them with grappling hooks on a muddy and disrupted sea bed, then pull them up to repair them.
For publications like Asia Sentinel and many others, which exist only online, the effect has meant a flat inability to operate. Hong Kong has only a single Internet gateway coming into the territory, meaning that the attempt to squeeze vast amounts of information through it has resulted in long delays. Bankers complained to the media that they were unable to execute trades because of their inability to secure verbal approval from overseas clients. Most dealing rooms were trading lightly because of the Christmas holidays. Nonetheless, bond and equity traders, who depend on the flow of real-time data, said they were hampered by the disruptions.
[...]
The cables handle traffic between China, Japan, Korea, Southeast Asia, the US and Taiwan. Taiwan lost almost all of its ability to communicate by telephone to Japan. Some 90 percent of capacity to Southeast Asia was wiped out. Two days later, Hong Kong was still largely without Internet service, leaving those with a vital need for the web with no ability to communicate. PCCW, the territory's primary Internet service provider, said data capacity had been cut in half. In China, according to China Telecom Corp., the mainland's largest fixed-line carrier, 97 percent of mainland Internet users had difficulty accessing overseas websites, and 57 percent said their lives and work had been affected.
While the largest amount of communications infrastructure goes through Taiwan a second set of lines goes out of Singapore, through Australia and on to the US. That set of lines is still up, but it was quickly overwhelmed by the amount of traffic switched to it.
Because everybody is competing for the available bandwidth, there is congestion now on the remaining bandwidth - a Singapore telecommunications spokesman told a local newspaper.
Ironically, inside China itself, domestic traffic is largely unaffected, since it is a domestic system closely guarded by authorities. Given China's closely monitored information system, there is no international access to the outside world.
Internationally, it was another case. The Internet Traffic Report, a website reporting on worldwide Internet use, reported that "packet loss", the discarding of data packets in a network when a device is overloaded and cannot accept incoming data, was still total in Shanghai two days after the earthquake. Indonesia was running at 50 percent and Singapore at 75 percent. Like China, Taiwan was unable to receive any data from outside the country.
I did, however, notice a lot of censorship of the world-wide web in China. The Wikipedia was completely blocked - but as the Wikipedia itself points out, "Technically adept Internet users in China are currently able to circumvent the block fairly easily."
The BBC and Voice of America were also blocked. And, any webpage mentioning the phrase "h-m-n r-ghts" was blocked. Now I read that "T--w-n ind-p-----ce" is also forbidden.
(Can someone in China let me know if they see this diary page, after the internet is working again?)
But, to my surprise, ABC, CBS, NBC and National Public Radio were completely accessible!
In many cases I could see the existence of blocked webpages via Google - but if I tried to click on them, I'd get an error message. Sometimes this would disable Google for a while afterwards... I never could quite figure out the pattern. At times I got scared that I'd hear a knock on my door. But, I figured they weren't mainly worried about Americans reading English-language websites.
This afternoon, Lisa and I got a marriage license at the
Riverside county clerk! We'll get married pretty soon....
December 29, 2006
More melting:
Arctic Ice Shelf Broke Off Canadian Island
Andrew C. Revkin
New York Times, December 30, 2006
A 41-square-mile shelf of floating ice that jutted into the Arctic Ocean for 3,000 years from Canada's northernmost shore broke away abruptly in the summer of 2005, apparently freed by sharply warming temperatures and jostling wind and waves, scientists said yesterday.
The Ayles ice shelf, as the ancient 100-foot-thick slab was called, drifted out of a fjord along the north coast of Ellesmere Island when the jumbled sheath of floating sea ice that tended to press against the coast there even in summers was replaced by open waters because of the warming, the scientists said.
The change was first noticed by Laurie Weir of the Canadian Ice Service as she examined satellite images taken of Ellesmere and surrounding ice on and after Aug. 13, 2005. In less than an hour, around midday that day, a broad crack opened and the ice shelf was on its way out to sea.
The shelf is one of the few remnants of a broad expanse of floating shelves of ice that once protruded along much of the Ellesmere coast, somewhat like the brim on a hat.
Such shelves are far thicker and older than the milling cloak of sea ice that drifts atop the Arctic Ocean. The sea ice consists of floes ranging from 3 to 9 feet thick or so that are built up over just a few years.
The Arctic sea ice has experienced sharp summertime retreats for several decades, adding to evidence of significant warming near the North Pole. (Neither melting ice shelves nor sea ice contribute to rising sea levels because they sit in the sea already, like ice cubes in a drink.)
Ninety percent of the 3,900 square miles of ice shelves that existed in 1906 when the Arctic explorer Robert Peary first surveyed the region are gone, said Luke Copland, the director of the University of Ottawa.s Laboratory for Cryospheric Research.
In a paper summarizing the event but not yet published, Dr. Copland and other researchers said that the transformation of the Ayles ice from a shorebound shelf to a drifting ice island appeared to be a result of unusual Arctic warmth in 2005 on top of a longer-term warming trend.
All this is small potatoes compared with Iceberg B-15, the largest known iceberg on record, which peeled off the Ross Ice Shelf of Antarctica in March 2000. According to the Iceberg FAQ, it was about 300 km × 27 km in area and roughly 500 meters thick.
That's about 4000 cubic kilometers, or 4 × 10¹² cubic meters,
or 4 × 10¹² tonnes, or 1000 cubic miles, or 1015
gallons - a "petagallon".
December 31, 2006
Our friend Lothar just came back from a trip to
Germany and Israel - but on New Year's Even, he had to catch a flight
to Hong Kong at midnight! So, we drove in to LA to have an early
dinner with him, along with Chris and Menakshee. Then we drove back,
getting home at 11. Chris and Menakshee drove him to the airport
(since all the cabs were busy) and caught up with us just in time to celebrate
the New Year. They spent the night at our house and then went to
Joshua Tree.
Lothar has a huge library - mainly about China. All his walls are lined with books, and he's constantly needing to buy new bookshelves. I grabbed ahold of this one, and liked it better than I expected:
The I Ching is an ancient Chinese text, dating back to the time when dates get very fuzzy - sometime between 1000 and 3000 BC, let's say. It describes the meaning of the 64 hexagrams - basically, strings of 6 bits, like this:

In these hexagrams, a solid line stands for yang (presence, positivity), while a broken line stands for yin (absence, negativity). As this famous symbol indicates:

yin and yang lead to each other in an endless round (as shown by the swirly pattern), and interpenetrate each other (as shown by the little dots).
The hexagrams correspond to complex mixtures of yin and yang, and each one has its own complicated personality. They're each built from two trigrams. For example, the one I just showed you:

is called "Dispersal" - it's the trigram for "wind"


Leibniz got the idea of binary digits from the hexagrams! The idea that everything is built up from a simple binary opposition is very appealing, though of course the ancient Chinese weren't able to make it scientific in the modern sense.
One thing I like about Wilhelm's book is the detailed discussion of the 8 trigrams. They make some sense if you know how the system works and are willing to engage in a bit of free-wheeling magical thinking. For example, the completely positive trigram:

(By the way, "positive" doesn't mean "good", and "negative" doesn't mean "bad".)
People use the I Ching for divination, and that's fun to try, but it may be better just to think about them.
Happy New Year! If you need a little optimism, try this:
© 2006 John Baez
baez@math.removethis.ucr.andthis.edu